Big datasets are fun. The bigger, the better, especially when you let people explore them live in their browser.
But there’s a catch: big datasets are slow to load.
Even with modern content delivery networks (CDNs), gzip compression, and high internet speeds, it can take a few seconds to load and parse a dataset. In my H1B salaries visualization, downloading data takes 1.7 seconds, parsing takes another 2 seconds, and rendering takes maybe a full second because some things are done stupidly.
That’s a full 4 to 5 seconds before a user sees anything more than a "Loading, please wait” message. Users are going to leave before they play with your dataset. Yes, even though it’s so cool and the data is amazing and awesome, users don’t give a shit. It’s sad. ☹️
But there’s a trick to keep them around → show them an image first!
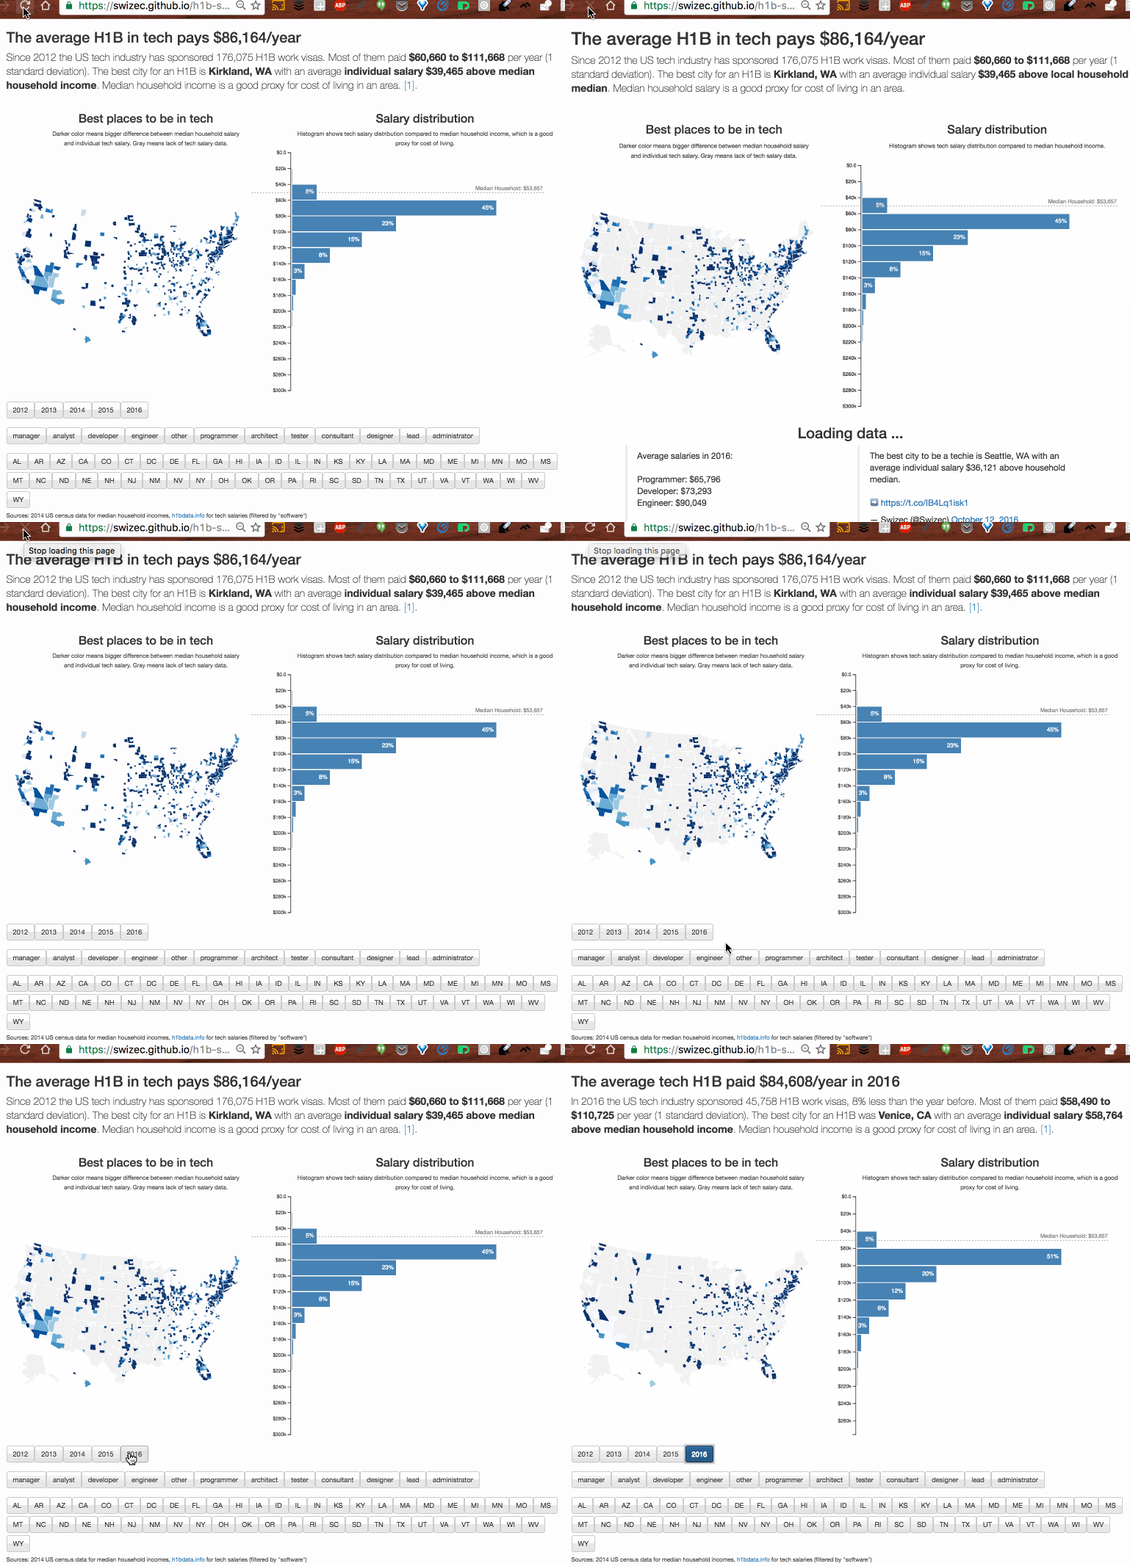
Check this out:

See how you barely notice the page refresh? That’s on purpose.
The main App.render() method is wrapped in a conditional statement that checks if the data is available. If it is, then we render the interactive visualization; if it isn’t, then we render a screenshot and default descriptions.
// src/App.jsrender() {if (this.state.techSalaries.length < 1) {return (<preloader>);}// render the main dataviz}</preloader>
The Preloader component can be a functional stateless component, like this:
// src/App.jsimport StaticViz from './preloading.png';const Preloader = () => (<div class="App container"><h1>The average H1B in tech pays $86,164/year</h1><p class="lead">Since 2012 the US tech industry has sponsored 176,075 H1B work visas. Most of them paid <b>$60,660 to $111,668</b> per year (1 standard deviation). <span>The best city for an H1B is <b>Kirkland, WA</b> with an average individual salary <b>$39,465 above local household median</b>. Median household salary is a good proxy for cost of living in an area.</span></p><img src={StaticViz} style="{{width:" '100%'}}=""><h2 class="text-center">Loading data ...</h2></div>);
The Preloader component mimics the structure of your normal dataviz, but it’s hardcoded. The information is real, and it’s what people are looking for, but it doesn’t need the dataset to render.
The easiest way to get this is to first build your real dataviz, then screenshot the picture, and then copy-paste the descriptions if they’re dynamic. Without dynamic descriptions, half your job is done already.
That’s about it, really:
- render an image
- wait for data to load
- replace image with dynamic dataviz
It sounds dumb, but increases user satisfaction 341324%.
If it works …

About the Author
Hi, I’m Swizec Teller. I help coders become software engineers.
Story time 👇
React+D3 started as a bet in April 2015. A friend wanted to learn React and challenged me to publish a book. A month later React+D3 launched with 79 pages of hard earned knowledge.
In April 2016 it became React+D3 ES6. 117 pages and growing beyond a single big project it was a huge success. I kept going, started live streaming, and publishing videos on YouTube.
In 2017, after 10 months of work, React + D3v4 became the best book I'd ever written. At 249 pages, many examples, and code to play with it was designed like a step-by-step course. But I felt something was missing.
So in late 2018 I rebuilt the entire thing as React for Data Visualization — a proper video course. Designed for busy people with real lives like you. Over 8 hours of video material, split into chunks no longer than 5 minutes, a bunch of new chapters, and techniques I discovered along the way.
React for Data Visualization is the best way to learn how to build scalable dataviz components your whole team can understand.
Some of my work has been featured in 👇