A coaching client showed me this design and asked: Ok, how do I build this?

Well hmm… it's a tree of some sort. Each icon is a node, and each line is an edge. Nodes can have multiple children. I think 🤔
You can build this with D3. Calculate each node's position, then iterate and render. An image \imported as an SVG component will do. Webpack can handle that for you.
So you have node positions and you know which nodes are connected. Now what?
You can turn that into pairs of coordinates. Point A to point B. A line between them.
D3 is perfect for that! Drawing lines from A to B is super easy 👇
// create a line path generatorconst line = d3.line();// pair of coordinatesconst data = [[0, 0], [100, 100]];// draw, using JSX notation
That draws a line from point (0, 0) to point (100, 100).
But we don't want straight lines. Straight lines don't look good.
Lucky for us, D3 has ample support for curves. Many different curve formulas to choose from.
We can add some curve to our line with the .curve method.
// create a line path generatorconst line2 = d3.line().curve(d3.curveCardinal);
If you try that, you'll see that nothing happens. Curves need multiple points in your line data to work well.
Like this 👇
That's a nice curve and all, but not quite what we're looking for. And if you look at the curve examples in D3 docs, you'll see that nothing quite fits.
After some experimentation, I found a solution.
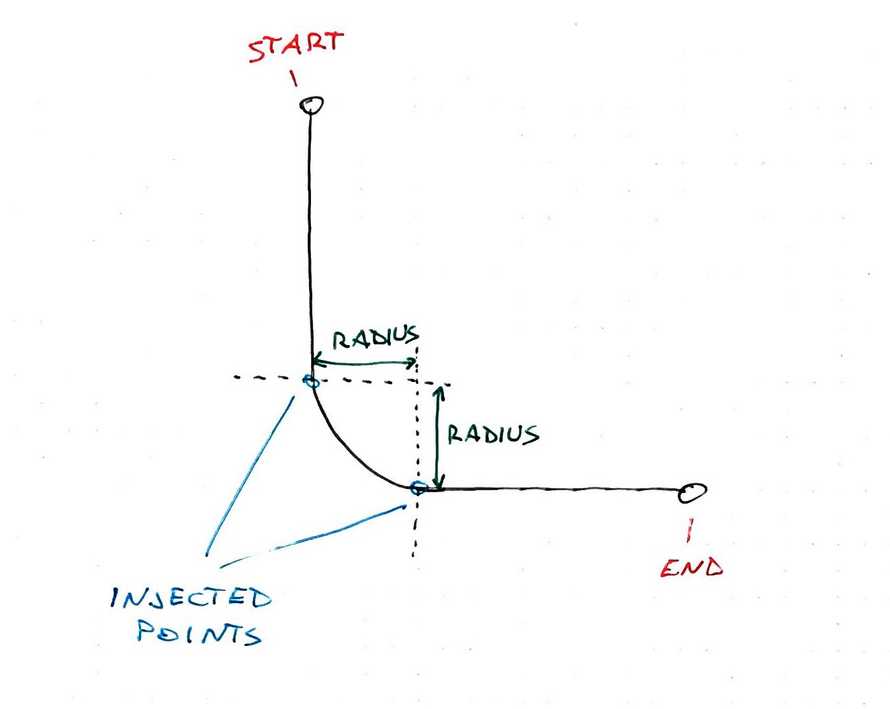
👉 a React component that takes 2 points, injects 2 juuuust perfectly spaced points, and draws a D3 curve between them.
The poorly named <RoundedCorner> component is just 15 lines of Prettier'd code. All values discovered experimentally.
const RoundedCorner = ({ start, end, radius = 5 }) => {const line = d3.line().x(d => d[0]).y(d => d[1]).curve(d3.curveBundle.beta(1));const points = [start,[start[0], end[1] - radius],[start[0] + radius, end[1]],end];return ;};
We take start and end coordinates, and the desired radius. Similar to CSS rounded borders.
Experimentally, I discovered that for best results, you have to place 2 points between the two endpoints. One on each side of the rounded corner you want.
Then you have to use the curveBundle generator with the beta factor set to 1. I honestly don't know what that means but it works.
You can see I tried a few different configurations in the example CodeSandbox. That's because some curves produced weird edges when turned around like that.
But not good ol' curveBundle.
About the Author
Hi, I’m Swizec Teller. I help coders become software engineers.
Story time 👇
React+D3 started as a bet in April 2015. A friend wanted to learn React and challenged me to publish a book. A month later React+D3 launched with 79 pages of hard earned knowledge.
In April 2016 it became React+D3 ES6. 117 pages and growing beyond a single big project it was a huge success. I kept going, started live streaming, and publishing videos on YouTube.
In 2017, after 10 months of work, React + D3v4 became the best book I'd ever written. At 249 pages, many examples, and code to play with it was designed like a step-by-step course. But I felt something was missing.
So in late 2018 I rebuilt the entire thing as React for Data Visualization — a proper video course. Designed for busy people with real lives like you. Over 8 hours of video material, split into chunks no longer than 5 minutes, a bunch of new chapters, and techniques I discovered along the way.
React for Data Visualization is the best way to learn how to build scalable dataviz components your whole team can understand.
Some of my work has been featured in 👇


