The new React 16.3 brings some changes to the ecosystem that change how we go about integrating React and D3 to build data visualizations. I previously wrote about this in Declarative D3 transitions with React 16.3
componentWillReceiveProps, componentWillUpdate and componentWillMount are on their way out. They were great for making React and D3 happy together, but they cause issues with async rendering that the React team is planning for React 17.
You tend to use those now-deprecated lifecycle methods to update D3 objects’ internal state. Things like setting scale domains and ranges, updating complex D3 layouts, setting up transitions, etc.
But you don’t need to! You can do it all with the new lifecycle API.
Here’s a small example of building a bar chart with React 16.3. Using only approved lifecycle callbacks 😏
https://www.youtube.com/embed/kH7bnSX9t4Q
You can play with it on CodeSandbox 👇
How it works
The core problem we're solving is that D3 objects like to keep internal state and React doesn't like that. We have to update D3 objects whenever our React component gets new props.
You have to update a scale mapping data to x-axis pixels whenever either data or width change. Traditionally you would do that in componentWillReceiveProps.
React docs recommend replacing componentWillReceiveProps with componentDidUpdate, but that leads to rendering stale charts. If you update your D3 scales after your component re-renders, that's too late.
Instead, we can move our scales into state and use getDerivedStateFromProps. 🤯
That's right, you can have complex objects in state now. It's totally safe.
No that’s fine, React won’t change them, it’s one of the new “was bad practice but is fine now” things that comes with async. You can even mutate their properties.
— Ryan Florence (@ryanflorence) April 12, 2018
Here's the gist of it 👇
D3 in state
Defining D3 objects as component properties used to be best. Now you should do it in your component state.
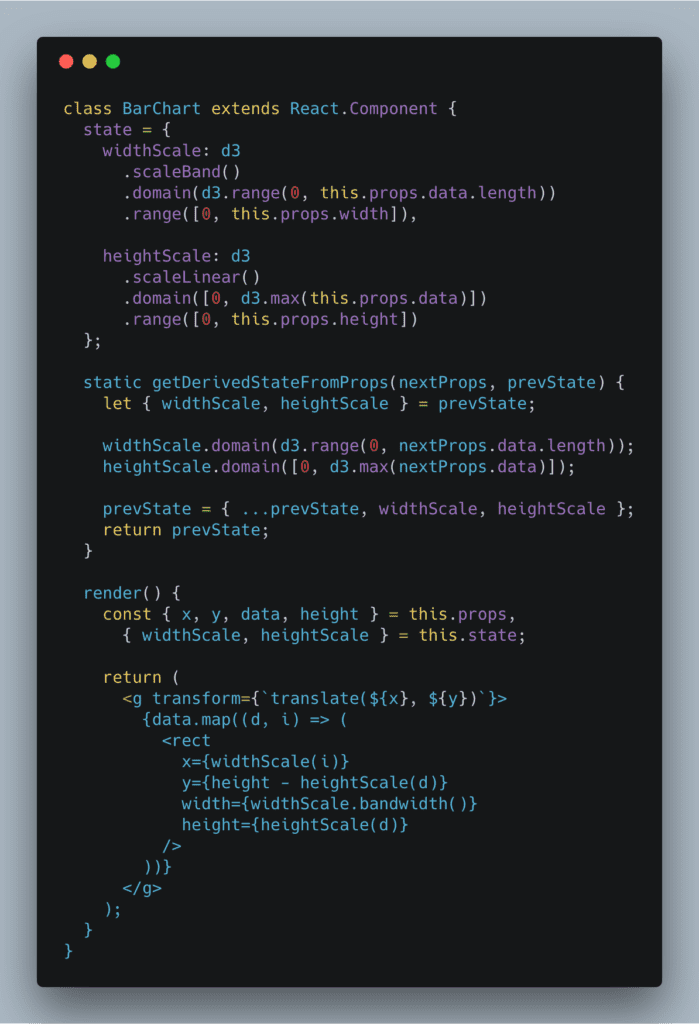
class BarChart extends React.Component {state = {widthScale: d3.scaleBand().domain(d3.range(0, this.props.data.length)).range([0, this.props.width]),heightScale: d3.scaleLinear().domain([0, d3.max(this.props.data)]).range([0, this.props.height])};
We define a widthScale and a heightScale. Each has a domain and a range that both depend on this.props. Yes you can do that in JavaScript class fields syntax.
Update D3 in getDerivedStateFromProps
You then use getDerivedStateFromProps to keep those scales up to date when your component updates.
static getDerivedStateFromProps(nextProps, prevState) {let { widthScale, heightScale } = prevState;widthScale.domain(d3.range(0, nextProps.data.length));heightScale.domain([0, d3.max(nextProps.data)]);prevState = { ...prevState, widthScale, heightScale };return prevState;}
It's a static method, which means no this keyword for you, you're running on the class, not an instance. You get the new props and the current state.
Take widthScale and heightScale out of props, update their domains, put them back. Probably should update their ranges too.
Render your chart
Now that your scales are always up to date, you can render your chart. Same as usual, D3 for props, React for rendering.
render() {const { x, y, data, height } = this.props,{ widthScale, heightScale } = this.state;return ({data.map((d, i) => ())});}
Get chart coordinates, data, and height from props. Grab widthScale and heightScale. Return a <g> element full of rectangles.
Each rectangle is rendered in a loop and takes its coordinates and dimensions from our scales.
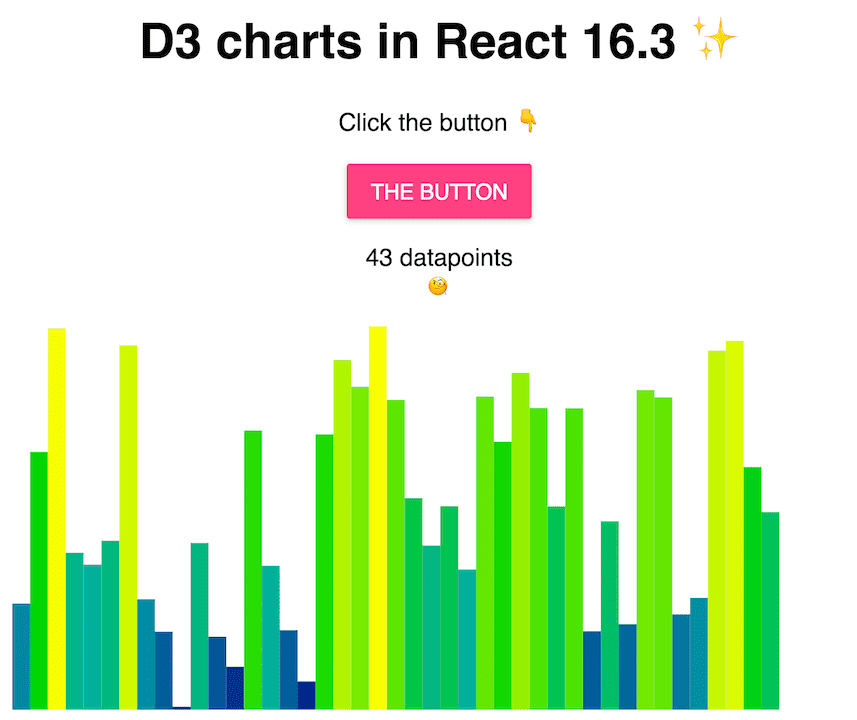
The result after a splash of color: A BarChart of random numbers where height and color correlate to the value. 
You can play with it on CodeSandbox.
Pushing it too far
You can render 100,000 SVG nodes in CodeSandbox if you're patient. Then you can't edit your code anymore.
You can render 100,000 SVG elements in @codesandboxapp and then you can't edit your code anymore.
👉 https://t.co/8IQCpZteAq pic.twitter.com/NRjp7iVWrE
— Swizec (@Swizec) April 27, 2018
About the Author
Hi, I’m Swizec Teller. I help coders become software engineers.
Story time 👇
React+D3 started as a bet in April 2015. A friend wanted to learn React and challenged me to publish a book. A month later React+D3 launched with 79 pages of hard earned knowledge.
In April 2016 it became React+D3 ES6. 117 pages and growing beyond a single big project it was a huge success. I kept going, started live streaming, and publishing videos on YouTube.
In 2017, after 10 months of work, React + D3v4 became the best book I'd ever written. At 249 pages, many examples, and code to play with it was designed like a step-by-step course. But I felt something was missing.
So in late 2018 I rebuilt the entire thing as React for Data Visualization — a proper video course. Designed for busy people with real lives like you. Over 8 hours of video material, split into chunks no longer than 5 minutes, a bunch of new chapters, and techniques I discovered along the way.
React for Data Visualization is the best way to learn how to build scalable dataviz components your whole team can understand.
Some of my work has been featured in 👇
