So… this started as an article about why recursion doesn't work in React. It looks like it works, then you npm run build, and it stops working.
Curious, right? Worth looking into, eh?
That's not the article you're getting. It started as that article, then I spent 3 hours building a Pythagoras tree fractal. It's 2:30am, and is my life even real?
Who the hell accidentally spends all night building fractals? Me… I guess.

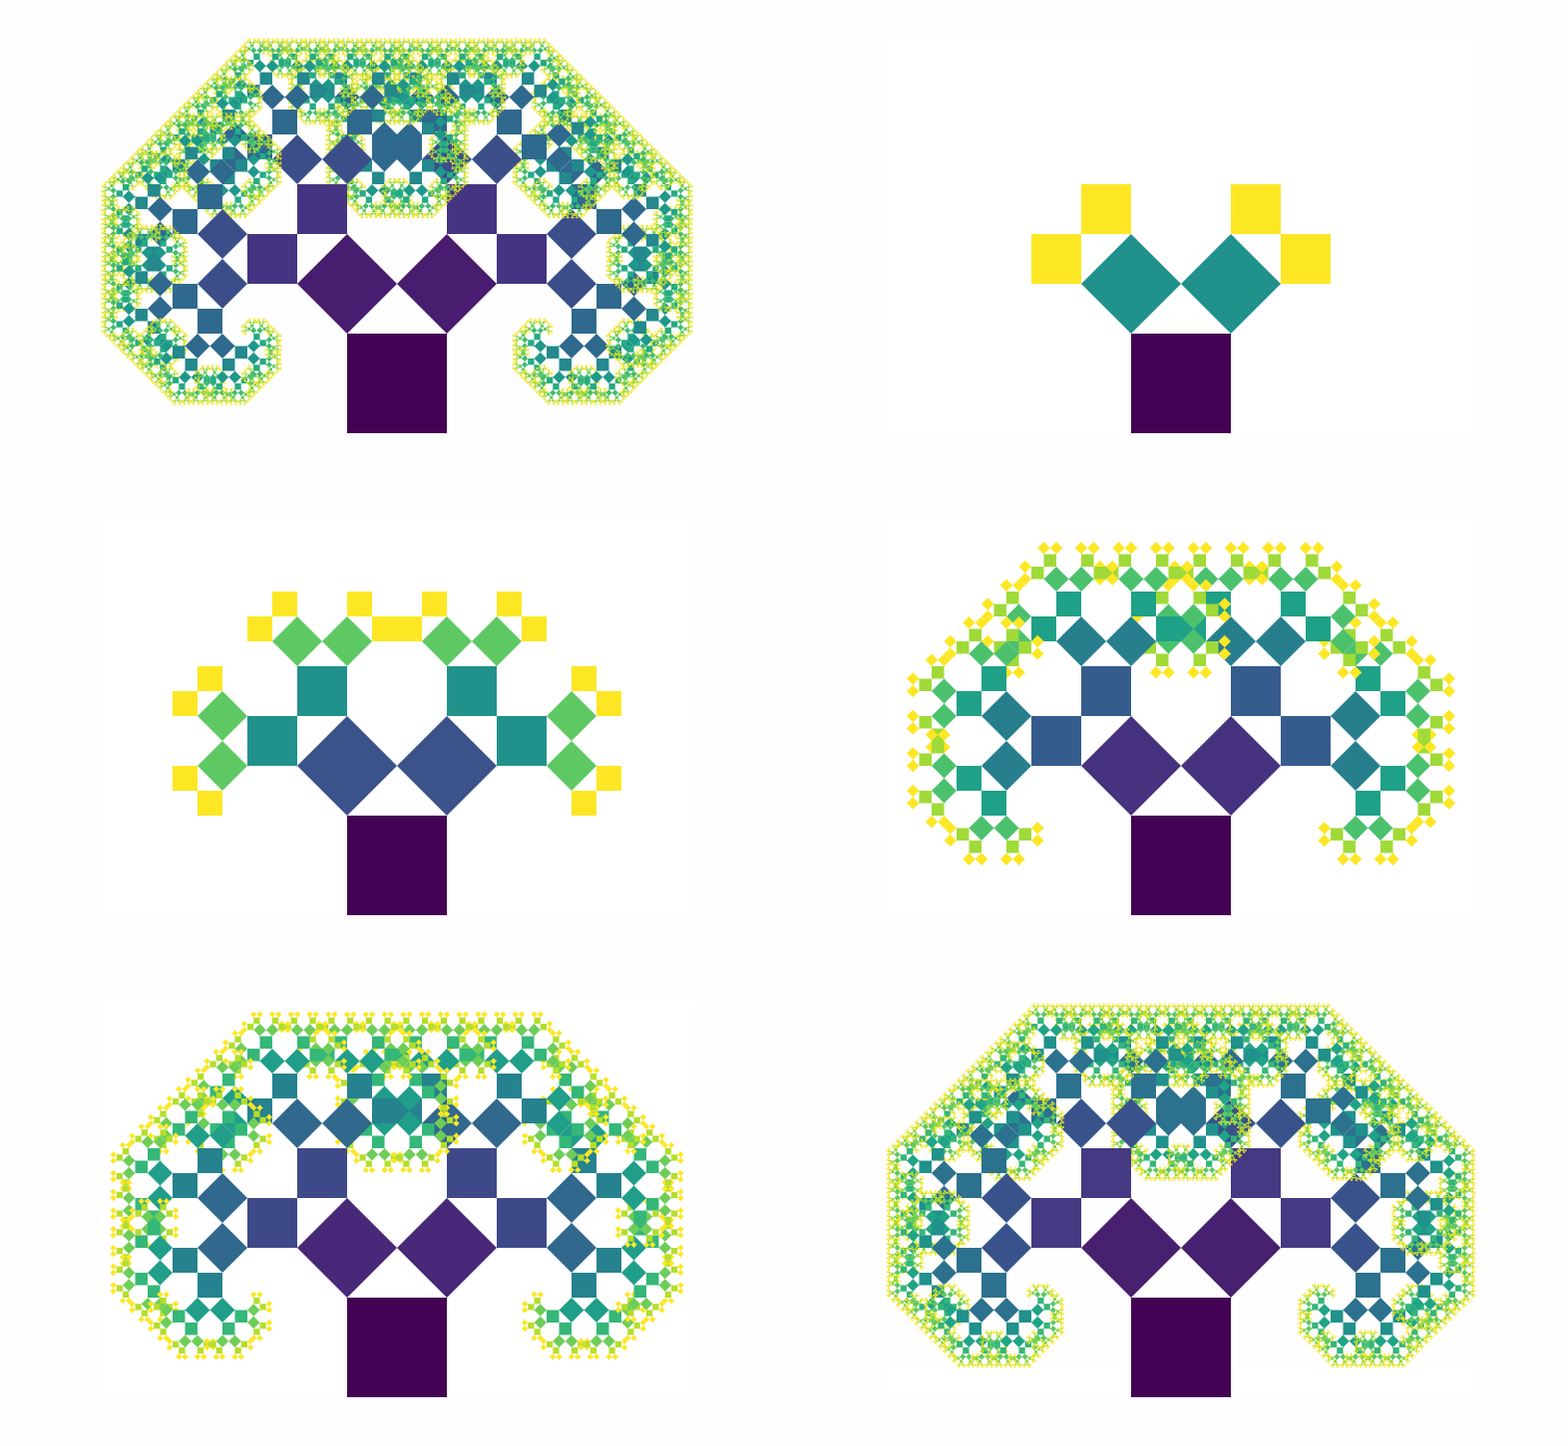
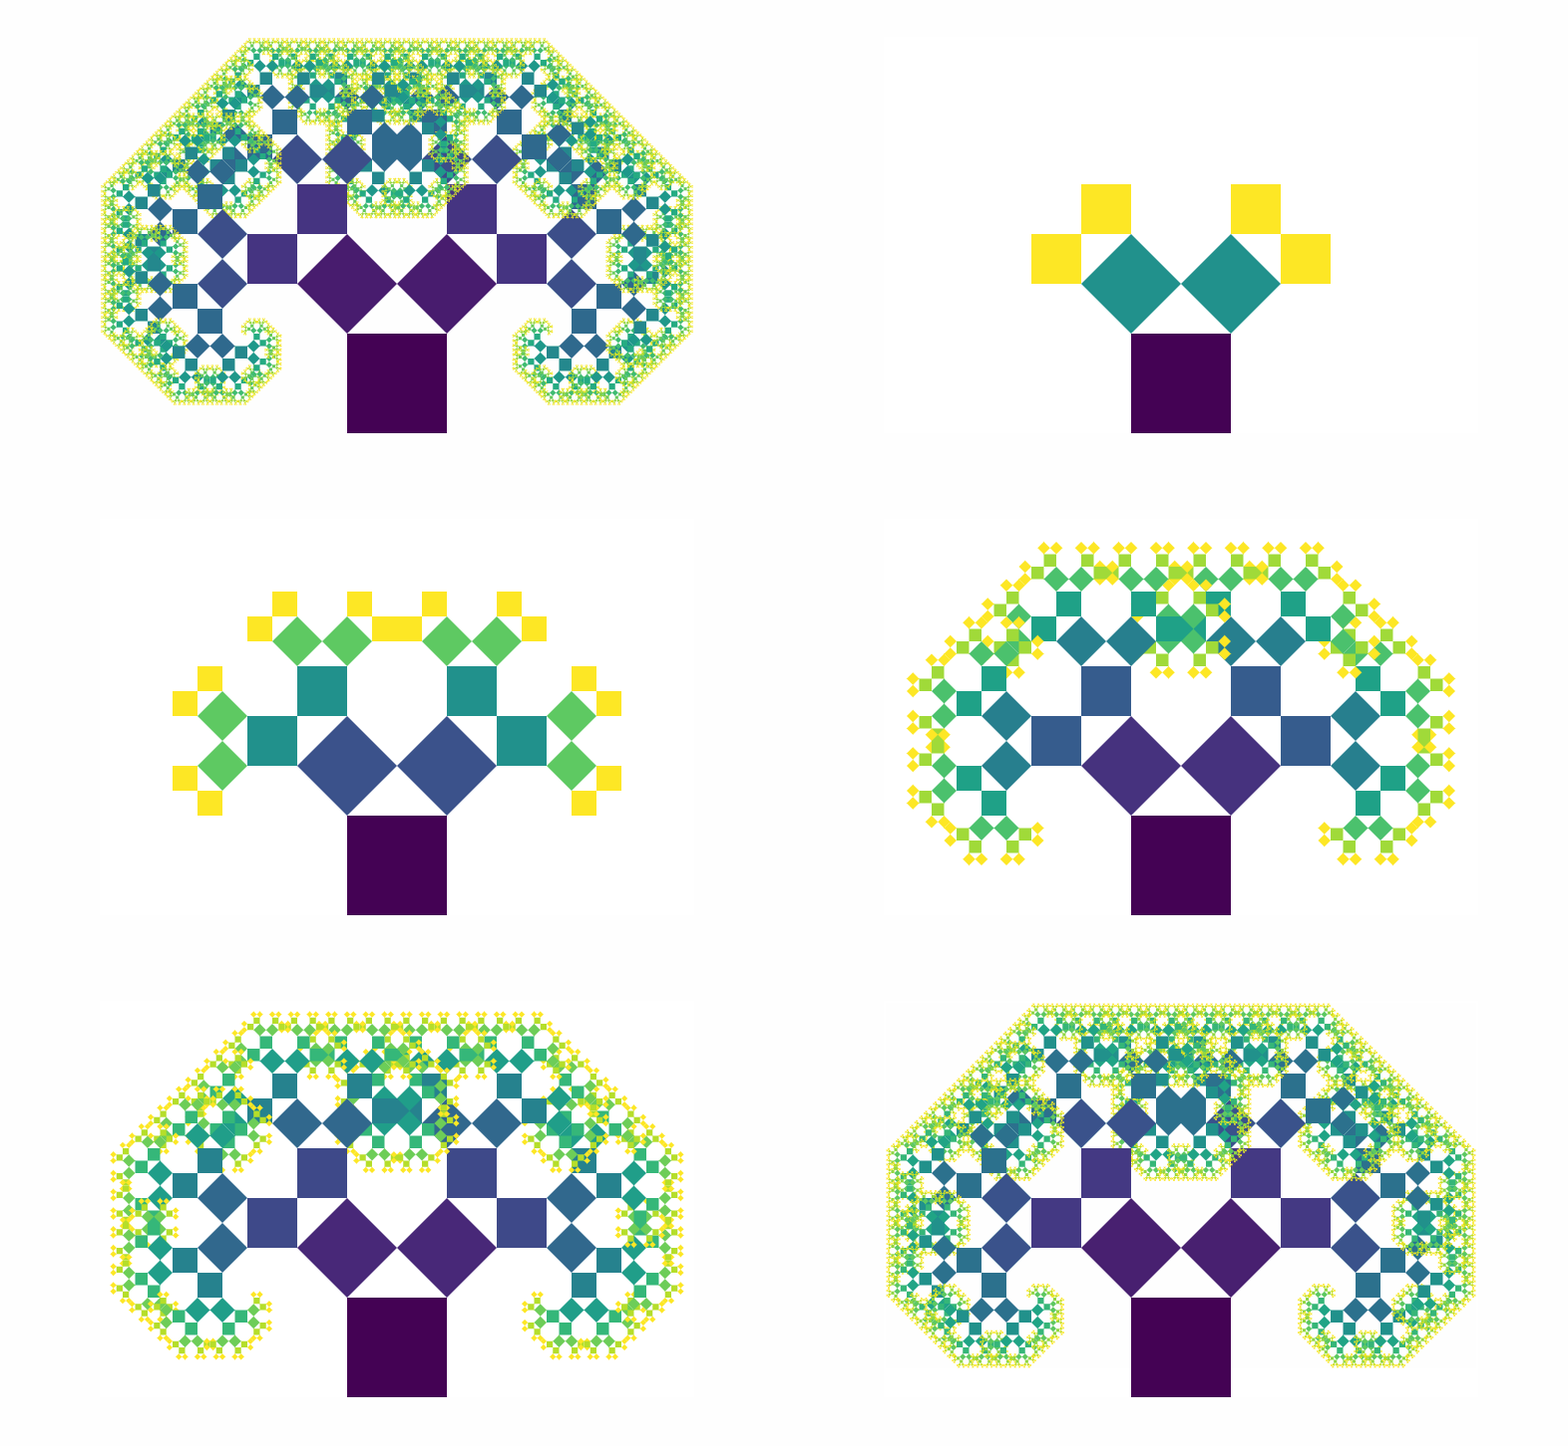
Pretty, innit? Built with React, and it's going to stop working when I npm run build. Still don't know why. I'll figure that out next week.
Here's how the Pythagoras tree works:
The construction of the Pythagoras tree begins with a square. Upon this square are constructed two squares, each scaled down by a linear factor of ½√2, such that the corners of the squares coincide pairwise. The same procedure is then applied recursively to the two smaller squares, ad infinitum.
?
That becomes four bullet points:
- 1 component called
<Pythagoras > - draws rectangle
- calculates props for next 2 rectangles
<Pythagoras><Pythagoras>
Which turns into some 30 lines of code:
\import React from 'react';\import { interpolateViridis } from 'd3-scale';const Factor = .5*Math.sqrt(2);const Pythagoras = ({ maxlvl, w, x, y, lvl, left, right }) => {if (lvl > maxlvl || w < 1) {return null;}const nextLeft = Factor*w,nextRight = Factor*w,d = nextLeft + nextRight + w,A = 45,B = 45;let rotate = '';if (left) {rotate = `rotate(${-A} 0 ${w})`;}else if (right) {rotate = `rotate(${B} ${w} ${w})`;}return ();};export default Pythagoras;
Beautiful. Let me explain.
interpolateViridis is a d3-scale that gives beautiful colors. Call it with an argument in [0, 1] and it returns a color.
Factor is the constant linear factor. We use it to calculate the sides of future rectangles.
d is the diameter of the triangle formed by the current square and two future squares. More on that later.
A and B are angles for each future rectangle. Set to 45 degrees statically.
Then we start drawing.
If we're in a left rectangle, we set up a left rotation; if right then a right rotation. rotate() is an SVG transformation that rotates the current coordinate system.
To draw the rectangle, we:
translateto(x, y), that means "move there"- add the rotation
- now our coordinate system is moved and rotate
- draw a rectangle at
(0, 0) - add two
<Pythagoras>with new parameters
And that's how you build a fractal in React. It won't work in production, but it sure looks pretty on your localhost.

The animation is done in App.js with a timer that updates the maxlvl prop every 500ms. Calling the root node of Pythagoras looks like this:
Start lvl at 0 and set the maxlvl. Those are \important. At maxlvl past 12 or 13, it stops working. It takes too much CPU power to ever render.
Yes, I tried. The naive algorithm isn't good enough. You could optimize by taking calculations out of recursion and preparing them in advance.
The part I can't figure out
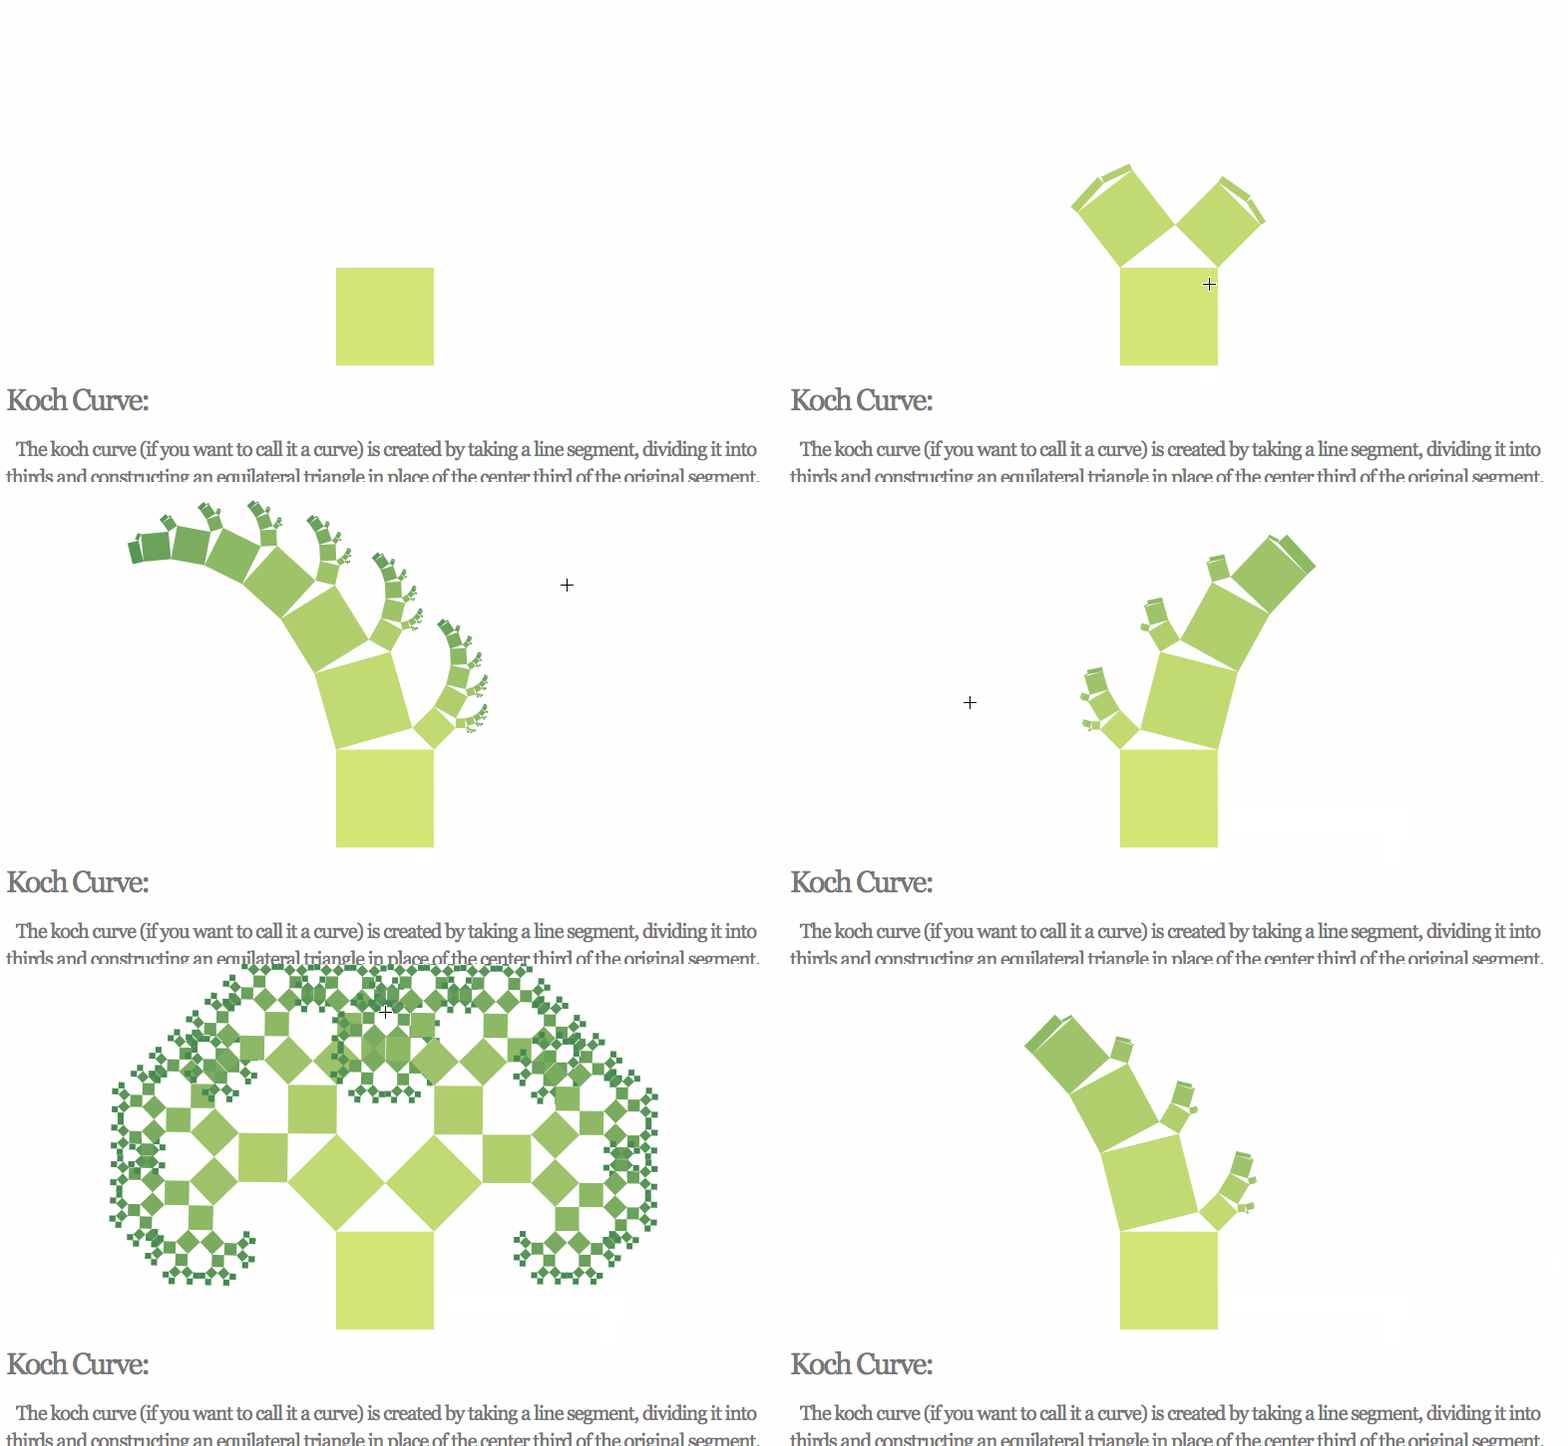
Look at Andrew Hoyer's Pythagoras tree. That thing is beautiful and flexible and dances like tree-shaped worm.

?
I can't figure out how to calculate those angles and rectangle sizes. I know that using .5 in the Factor is for 45 degree angles.
You can change the ratio by using a .3 and .7 factor for each side. Then it stops working with 45 degree angles yeah.

Ok, that was expected. Since you know all the sides, you should be able to apply the Law of Sines to calculate the angle.
const nextLeft = .3*Factor*w,nextRight = .7*Factor*w,d = nextLeft + nextRight + w,A = Math.degrees(Math.asin(nextRight/d)),B = Math.degrees(Math.asin(nextLeft/d));

I can't figure it out. I'm pretty sure I'm applying the Law of Sines correctly, but the numbers it throws out are wrong.
Halp ?
PS: Here's a paper that describes using Pythagoras trees as data structures. Sort of.
About the Author
Hi, I’m Swizec Teller. I help coders become software engineers.
Story time 👇
React+D3 started as a bet in April 2015. A friend wanted to learn React and challenged me to publish a book. A month later React+D3 launched with 79 pages of hard earned knowledge.
In April 2016 it became React+D3 ES6. 117 pages and growing beyond a single big project it was a huge success. I kept going, started live streaming, and publishing videos on YouTube.
In 2017, after 10 months of work, React + D3v4 became the best book I'd ever written. At 249 pages, many examples, and code to play with it was designed like a step-by-step course. But I felt something was missing.
So in late 2018 I rebuilt the entire thing as React for Data Visualization — a proper video course. Designed for busy people with real lives like you. Over 8 hours of video material, split into chunks no longer than 5 minutes, a bunch of new chapters, and techniques I discovered along the way.
React for Data Visualization is the best way to learn how to build scalable dataviz components your whole team can understand.
Some of my work has been featured in 👇