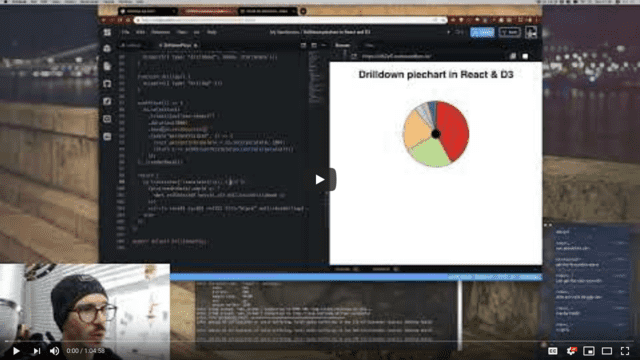
Here's part 2 of Kiran B's challenge from last week 👉 animating our drilldown piechart.
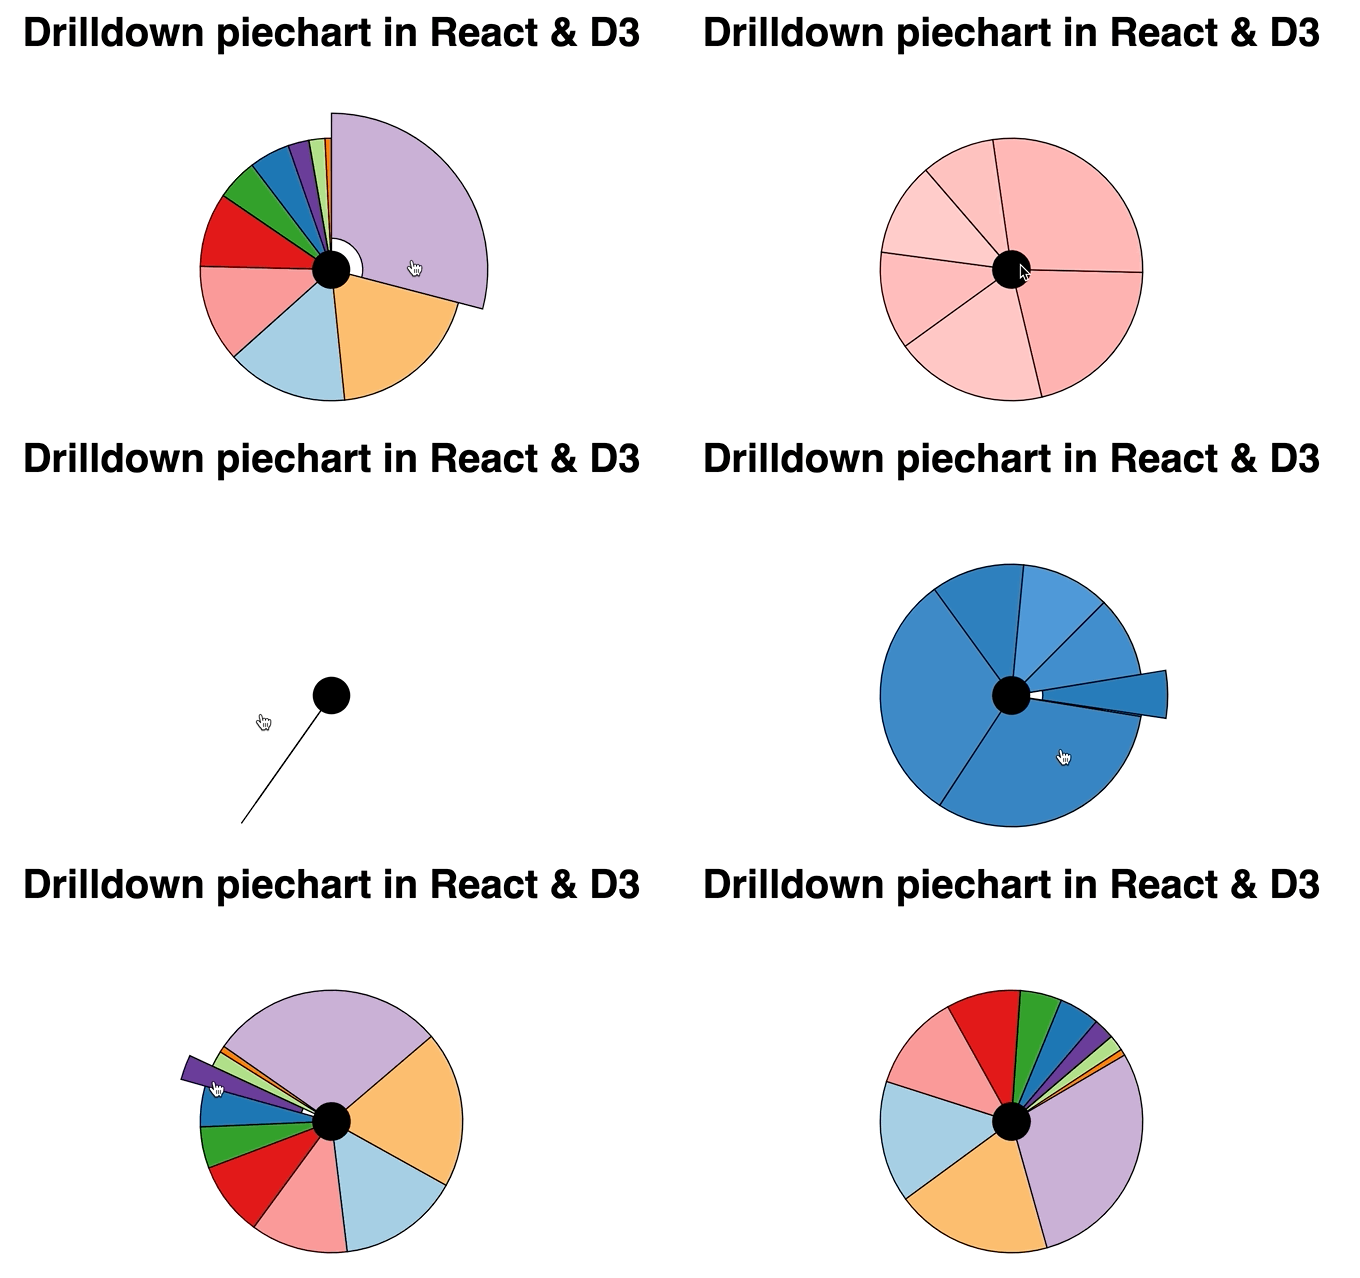
You can watch the whole stream or keep reading. This was fun to figure out. I'm loving the flexibility of this hybrid approach to animation.
Yelling at my computer when it got too slow to run CodeSandbox was A+ 👌
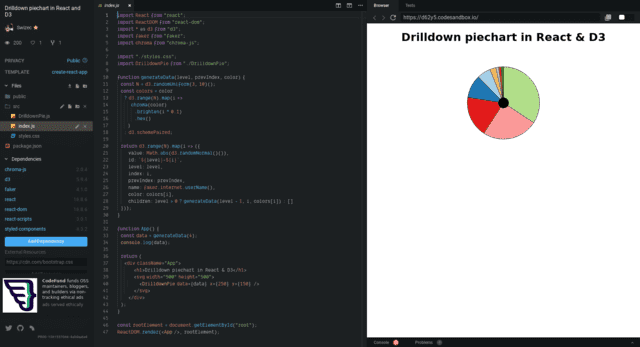
And if you prefer to jump straight into messing around with code, here's the CodeSandbox
Wtf is hybrid animation?
Hybrid animation is a merger of two approaches to animation I teach in React for Data Visualization. Also a brand new chapter I just added ✌️
- Change state 60 times per second, trigger re-renders, components look animated
- Give control to D3, use a transition, move back to React
Both those approaches work great.
You get heaps of control with the state-based approach, it's fast, the animations look sick, and you spend a lot of brain cycles thinking about details.
Transitions are easier, look great, and you mess with the DOM just a little. React doesn't like that but will tolerate your shenanigans if you're nice about it.
But transitions fail when you have complex scenarios with animations spanning multiple components.

And that's where hybrid animation comes in 👉 ease of transitions, full render control.
Cleaning up our piechart
We're working off of the drilldown piechart from last week. So we've got the basics
- Hierarchical data where each slice has multiple children
<Arc>component that renders individual slices<DrilldownPie>that uses ad3.pie()generator and renders slices in a loop
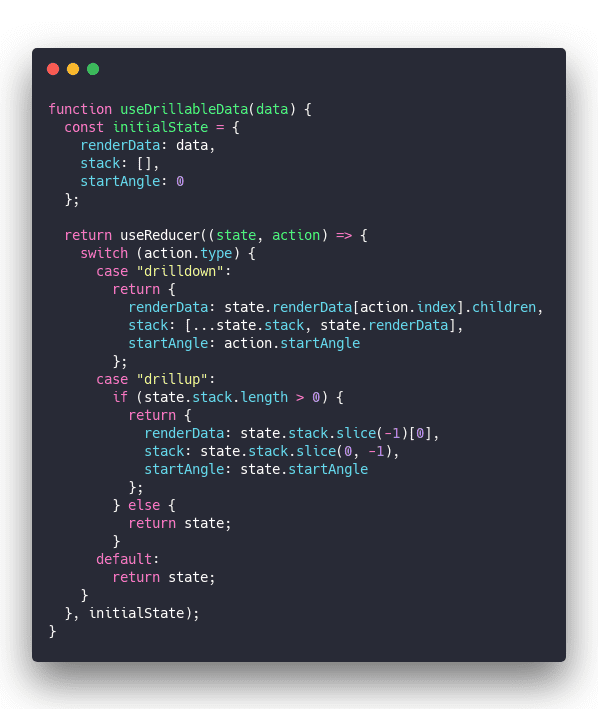
We cleaned up state management and added the drill-up feature.
useDrillableData is a custom hook that takes our data and sets up a reducer so we can tie different state changes together.
When you drilldown we
- change
renderDatato the children array; this creates the drilldown effect - add current data to the
stack; this will help us know how to drill back up - update
startAngleso pie animations look connected to what you clicked
When you drilldown we
- pop the previous data from the
stackand updaterenderData - drop the last element in our
stack - keep the same
startAngle
If you're at the highest level already, we do nothing.
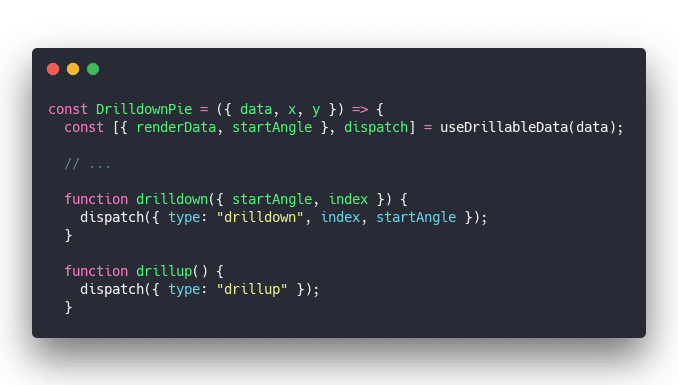
To use this new state management mechanism we replaced the previous useState code with useDrillableData and called dispatch on click events instead of setState.
Now <DrilldownPie> can go in both directions. That was a problem before 😅
Adding hybrid animation
Hybrid animation is all about leveraging both React and D3 for what they do best: React manages rendering and events, D3 calculates the tricky stuff for smooth animations.
Here's the recipe:
- trigger a React effect
- start a D3 transition
- create a custom tween
- use the tween to drive state
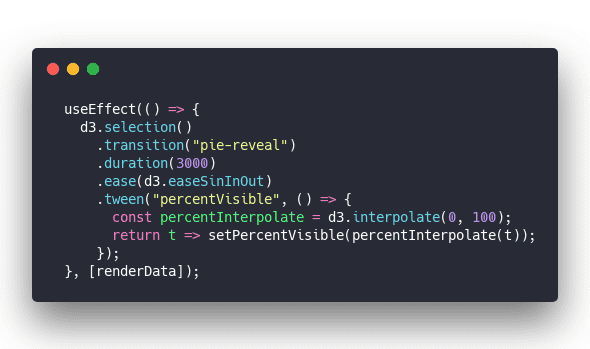
useEffect runs its method when renderData changes. That's every time you drilldown or drillup.
The effect runs a D3 transition on an empty selection. Sets duration to 3 seconds, an easing function to look pretty, and fires off a custom tween.
Tweens are meant to manipulate DOM attributes, but when you think about it, they're just functions that run on every step of the transition. They can do whatever you want to do on every keyframe. 🤔
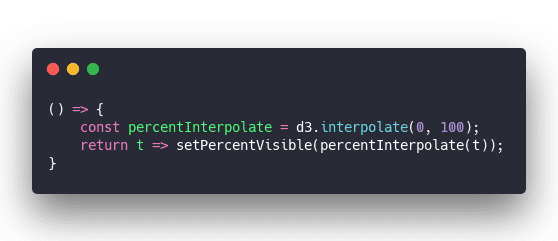
We start with an interpolator from 0 to 100. Interpolators translate the time parameter, t, into a smooth transition from start to end. Easing functions manipulate that t parameter to create fun effects.
Interpolator in hand, we return a parametrized function that updates state with setPercentVisible using the interpolator.
percentVisible state
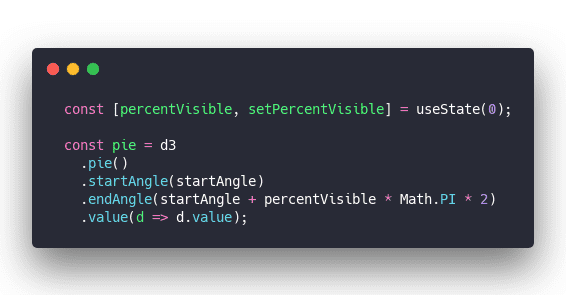
Using that state change to animate our piechart looks like this:
percentVisible and setPercentVisible come from a useState hook. Getter and setter :)
D3 pie generators take a startAngle and endAngle config and fit the entire piechart between those angles. If we keep changing the endAngle to be closer and closer to a full circle based on percentVisible, we get an animation that looks like a piechart revealing itself.

Neat 🤘
Wat gives

The trick here is that React hooks are magic and the tree diffing algorithm is fast as hell.
On each step of the transition, our tween changes state and triggers a re-render. When the piechart re-renders, it uses the updated angle.
The updated angle creates a bigger piechart. The arc components adjust and make themselves fit inside.
Crucially, React doesn't re-run the effect. Nothing that our effect relies on changed, so it keeps running uninterrupted.
The result is a powerful new animation technique ✌️
Cheers,
~Swizec
About the Author
Hi, I’m Swizec Teller. I help coders become software engineers.
Story time 👇
React+D3 started as a bet in April 2015. A friend wanted to learn React and challenged me to publish a book. A month later React+D3 launched with 79 pages of hard earned knowledge.
In April 2016 it became React+D3 ES6. 117 pages and growing beyond a single big project it was a huge success. I kept going, started live streaming, and publishing videos on YouTube.
In 2017, after 10 months of work, React + D3v4 became the best book I'd ever written. At 249 pages, many examples, and code to play with it was designed like a step-by-step course. But I felt something was missing.
So in late 2018 I rebuilt the entire thing as React for Data Visualization — a proper video course. Designed for busy people with real lives like you. Over 8 hours of video material, split into chunks no longer than 5 minutes, a bunch of new chapters, and techniques I discovered along the way.
React for Data Visualization is the best way to learn how to build scalable dataviz components your whole team can understand.
Some of my work has been featured in 👇
