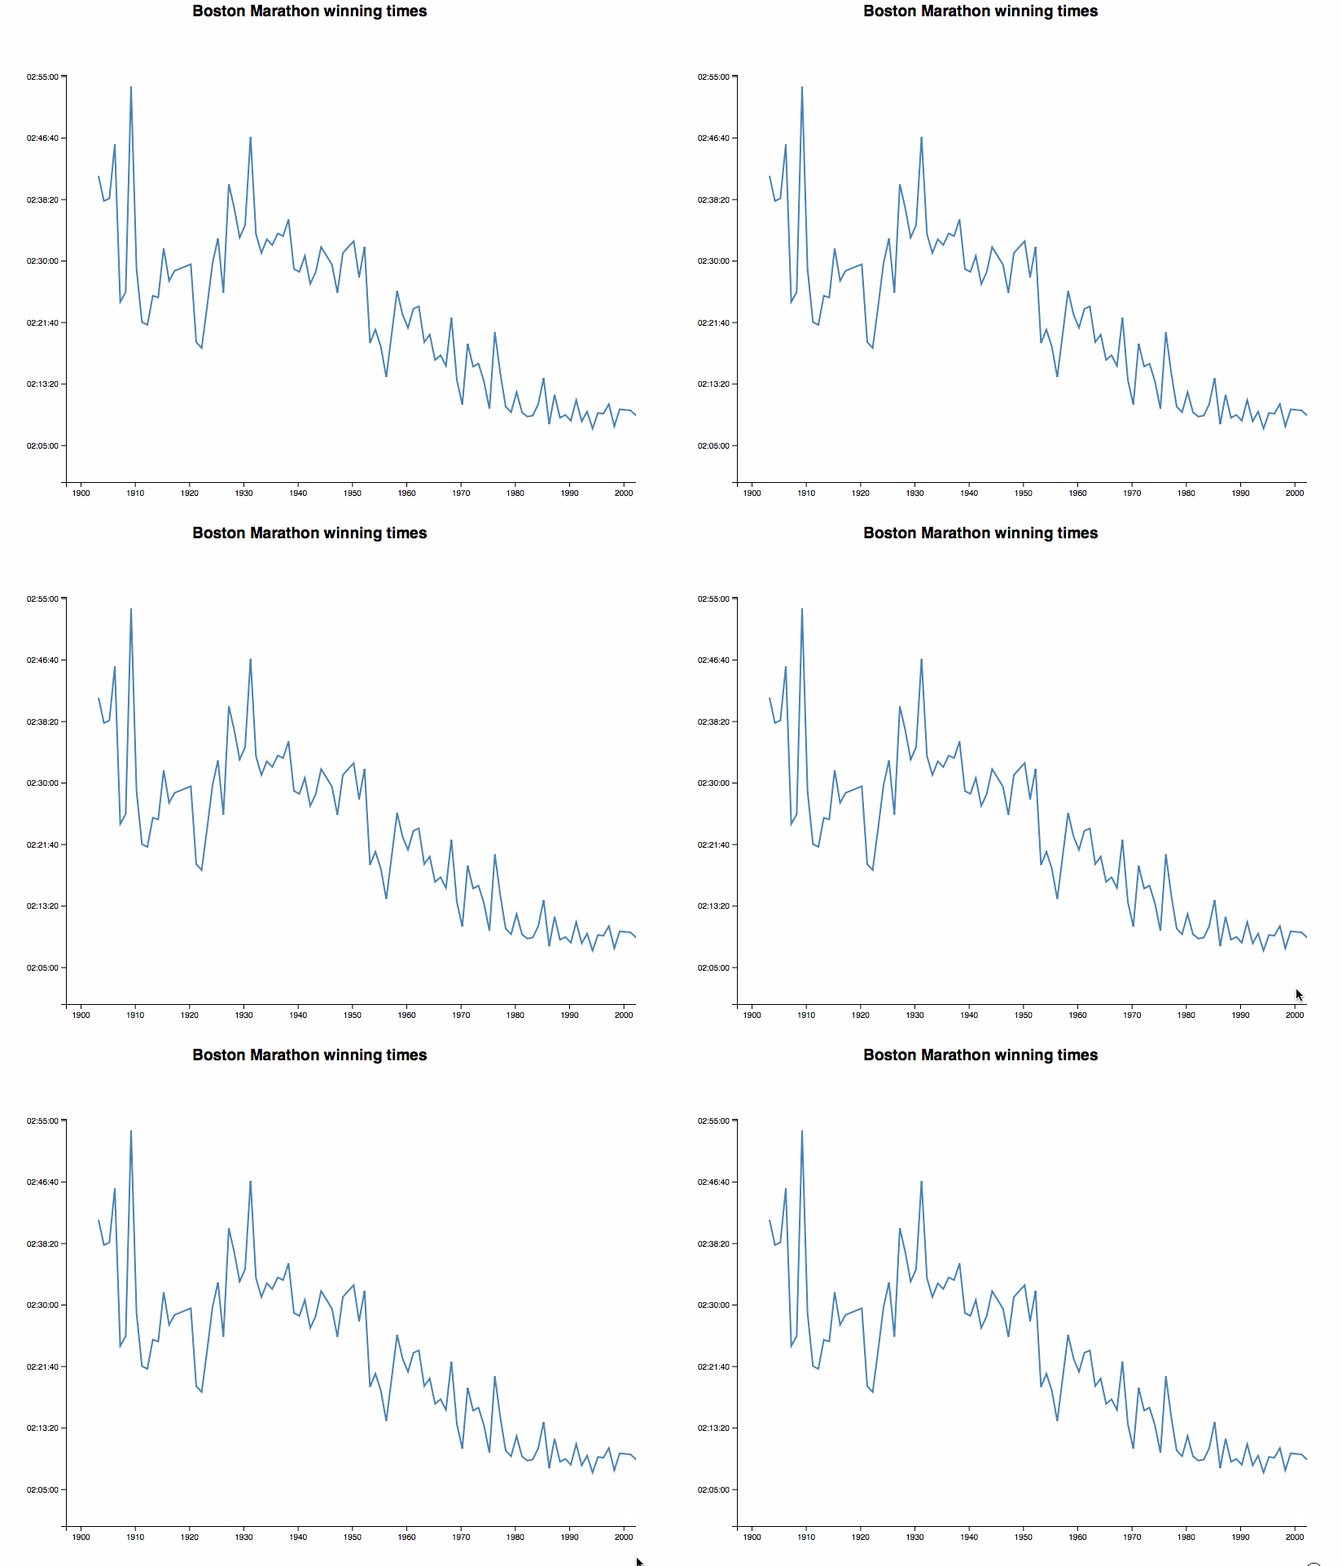
The Flash of Doom is one of the most annoying issues with D3 charts. You load the page, then you load the data, then you render your chart.
Everyone's staring at a blank screen while the data loads.
With React 16, we can fix that using server-side rendering and the new ReactDOM.hydrate feature. The idea is to serve a fully rendered chart in the initial HTML payload, then take over with JavaScript and become a normal webapp.

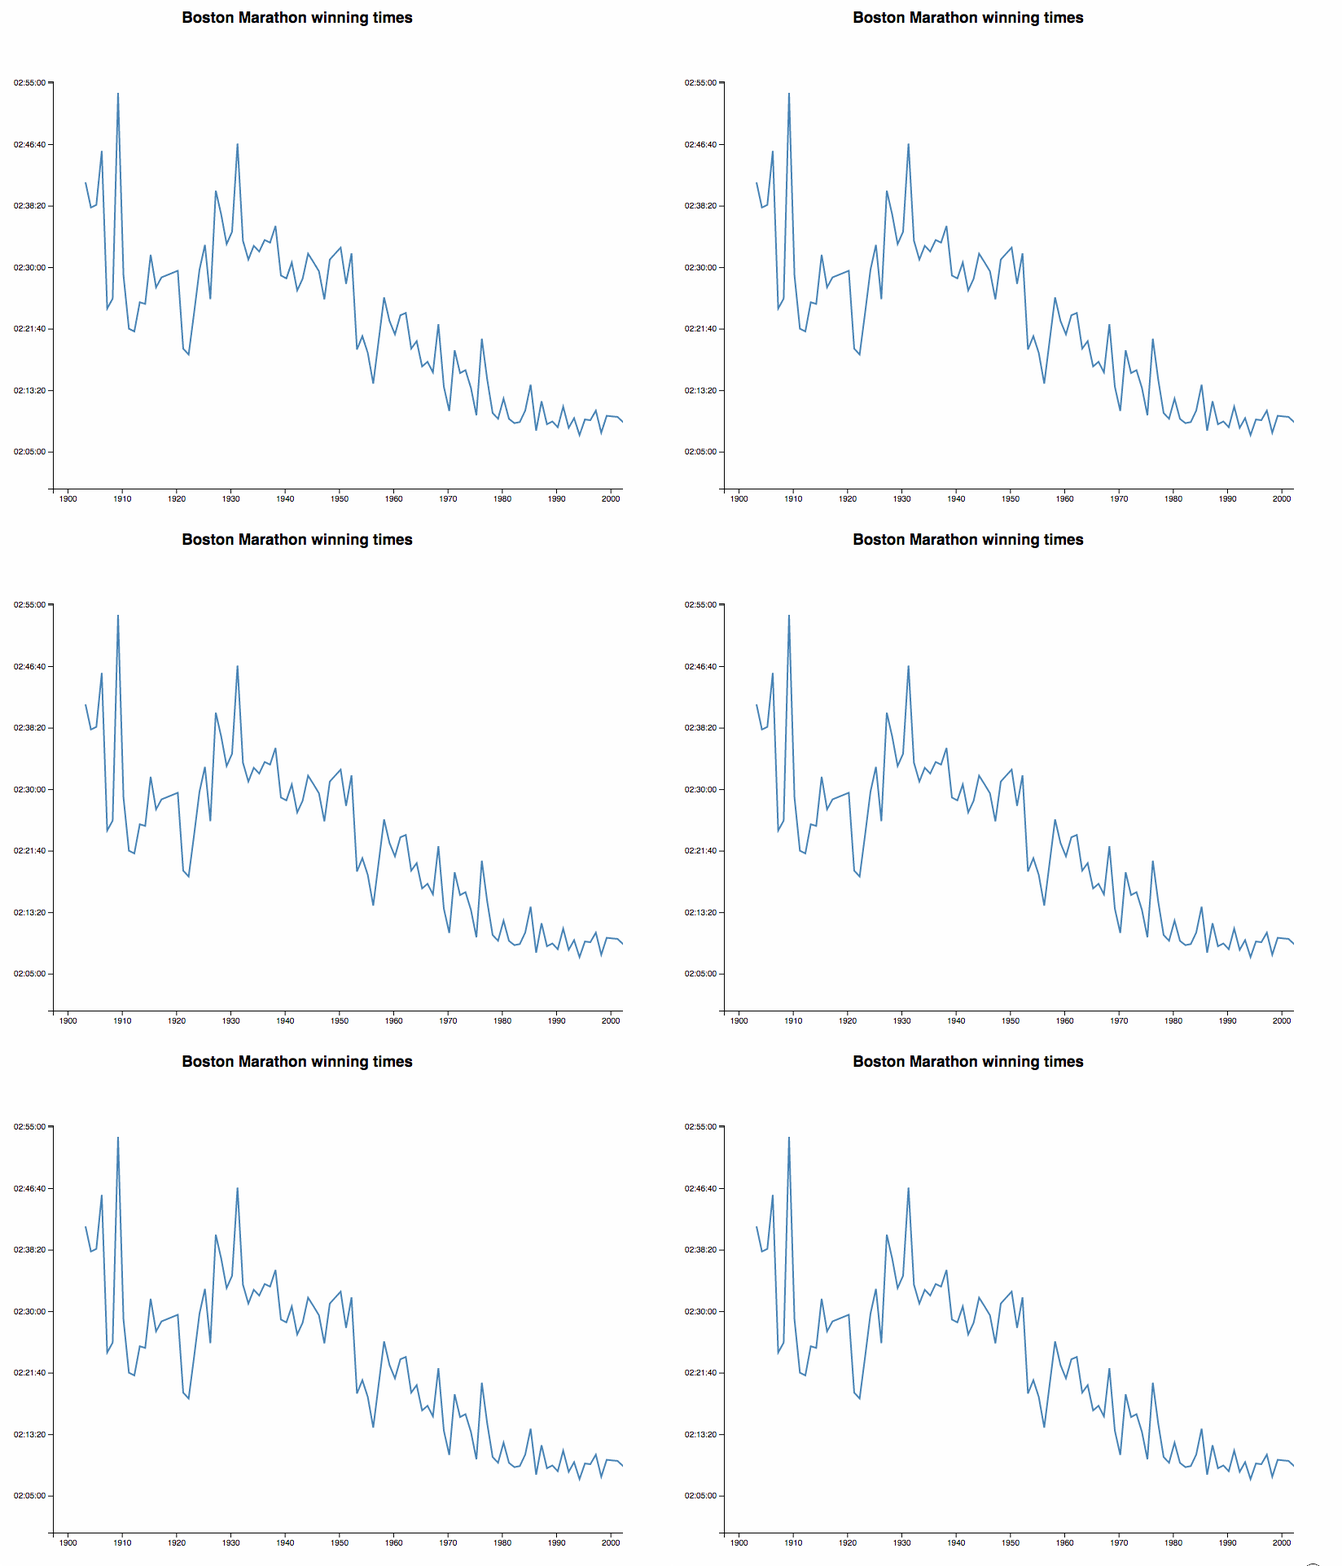
Pay close attention to that gif. The flashing red shows repaints.
When I reload the page, the whole thing re-renders and shows a line chart. Axes show up after a little while, and they're the only part of the page that re-renders.
Here's a slower version without the flashing.

Here's what you're seeing 👇
- You hit reload
- Server reads
index.htmlfrom create-react-app - Server reads local CSV file with data
- Server renders
<App />into root HTML element - Server sends the full
index.htmlto your browser - Browser shows HTML with the chart
- Browser loads remote CSV file with data
- Browser runs
ReactDOM.hydrate()to render<App /> <App />takes over the DOM and becomes a normal webapp
Some parts of this are efficient.
ReactDOM.hydrate avoids re-rendering parts of the DOM that were already rendered by your server. In our case, that's everything except the axes.
Some parts of this are inefficient.
The server shouldn't need to read the CSV and HTML files on every request. You could do that on startup and save the strings in a variable. They're static.
We're also rendering <App /> and running all of our React code twice. But this doesn't need to happen every time on the server. Cache that stuff!
How to
You can try it out for yourself on Github.
The hardest part was adding a small Express server to create-react-app that supports \import and React syntax. I couldn't figure it out on my own, so I used Ben Lu's amazing SSR with create-react-app guide.
The main trick seems to be installing ignore-styles so your server doesn't error out when require-ing CSS files (no webpack), and figuring out just the right incantation of Express setup to get the server working. I tried simplifying his setup, but it didn't work.
In the end, your best bet might be to just copy his server/ directory and go from there. Adapt server/universal.js to render your <App /> instead of his ReactRouter stuff.
You also have to go into public/index.html and add {{SSR}} to the body of <div id="root">. The server looks for {{SSR}} and replaces it with the rendered HTML from your React app.
You can see my server-side code that reads a CSV file and renders the chart into a string on Github.
Adapting your React D3 app to server-side
Adjusting to server-side rendering required a small mind shift in the way I built my chart. Usually, I like to use componentWillMount in the <App /> component to load data. Until data loads, the app renders a null; after that, it returns a chart component.
This makes apps easy to build and avoids issues with undefined data when rendering.
But it throws away all benefits of server-side rendering. With the componentWillMount approach, you're loading the fully rendered chart, replacing it with an empty component, then re-rendering it once data loads on the client.
Here's what you do instead: Accept data as props. Only load in componentWillMount if no data was given.
Like this 👇
class App extends Component {constructor(props) {super(props);this.state = {data: (props.data || []).map(this.rowParse)}}dateParse = d3.timeParse("%d %b %Y");rowParse = ({ date, time, runner }) => ({date: this.dateParse(date),time: time.split(':').map(Number).reverse().reduce((t, n, i) => i > 0 ? t+n*60**i : n),runner});componentWillMount() {if (!this.state.data.length) {d3.csv("https://raw.githubusercontent.com/Swizec/server-side-d3-poc/master/src/data.csv").row(this.rowParse).get(data => this.setState({ data }))}}// render stuff}
In the constructor, we copy data from props into state. That's because components that load their own data usually keep it in state and putting it there means fewer changes to the rest of your code.
rowParse is a helper method that turns individual rows from CVS strings into correct data types: dates for date, seconds for time to win the marathon, and runner stays a string.
In componentWillMount, we now check if data is already present. If it isn't, we load it and everything works the same as it always has.
Hydrate after data loads
The final piece of the puzzle is hydrating your app after your data is done loading. You're already showing a chart, so there's no need to be hasty and ReactDOM.hydrate as soon as your JavaScript loads.
https://twitter.com/dan_abramov/status/913353504856723458
You can't detect that your component already had children and avoid replacing them until you're ready. Instead, you can wait to hydrate in the first place.
d3.csv("https://raw.githubusercontent.com/Swizec/server-side-d3-poc/master/src/data.csv").row(this.rowParse).get(data =>ReactDOM.hydrate(, document.getElementById('root')));
And you have successfully solved the Flash of Doom seen in most D3 charts.
\o/
Caveat
Now you need a server. No more static page serverless webapp for your beautiful chart. No gh-pages and simple hosting…
You could use now.sh, and that's nice, but I don't know how to make it run my server. See 👉 https://server-side-d3-poc-mamdozxwze.now.sh
The panacea is to figure out how to tweak the create-react-app build process to insert your server-side rendered <App> right into its index.html. That's what I really want.
I wonder if they'd accept a PR for that 🤔
About the Author
Hi, I’m Swizec Teller. I help coders become software engineers.
Story time 👇
React+D3 started as a bet in April 2015. A friend wanted to learn React and challenged me to publish a book. A month later React+D3 launched with 79 pages of hard earned knowledge.
In April 2016 it became React+D3 ES6. 117 pages and growing beyond a single big project it was a huge success. I kept going, started live streaming, and publishing videos on YouTube.
In 2017, after 10 months of work, React + D3v4 became the best book I'd ever written. At 249 pages, many examples, and code to play with it was designed like a step-by-step course. But I felt something was missing.
So in late 2018 I rebuilt the entire thing as React for Data Visualization — a proper video course. Designed for busy people with real lives like you. Over 8 hours of video material, split into chunks no longer than 5 minutes, a bunch of new chapters, and techniques I discovered along the way.
React for Data Visualization is the best way to learn how to build scalable dataviz components your whole team can understand.
Some of my work has been featured in 👇
