[caption id="attachment_8254" align="alignnone" width="1024"] A pie streaming in some data[/caption]
Today, I finally figured out how to build smooth D3 arc transitions. 🎉
Got some help from Bostock's commented arc tween block and Andy Shora's guide on tweening custom shapes and paths in D3.js.
The single most \important requirement to perform interpolation in D3.js is that the structure of A must match the structure of B.
~ Andy Shora
That quote made it click. D'oh! So obvious.
Why arc transitions are hard
You see, the problem with arc transitions is that their path definition has a funny shape. It looks like this:
M100.6434055594246,-99.8203632756589A8,8,0,0,1,112.2823856114007,-99.46188154973098A150,150,0,0,1,-104.56274177607584,107.54828233063364A8,8,0,0,1,-104.38099615277264,95.90520136696549L-64.39381262786019,59.38549403963366A8,8,0,0,1,-53.635344263429694,59.35696964757701A80,80,0,0,0,61.78081312913049,-50.82451307295977A8,8,0,0,1,62.30830828934212,-61.57007978883599Z
If that doesn't make sense, don't worry. I can't read it either. Maybe Sarah Drasner can, she's an SVG goddess 🤔
PS: she can 👇
https://twitter.com/sarah_edo/status/971840965488119809
When you build a transition, you're trying to smoothly move from A to B. To get from 0 to 1, you go through 0.1, 0.2 and so on.
But a path definition is more complex.
You're dealing with a bunch of numbers that have to move just right. Change them all together, and funny things may happen like arcs flying around the screen.
Or an error. 😬
[caption id="attachment_8256" align="alignnone" width="1024"]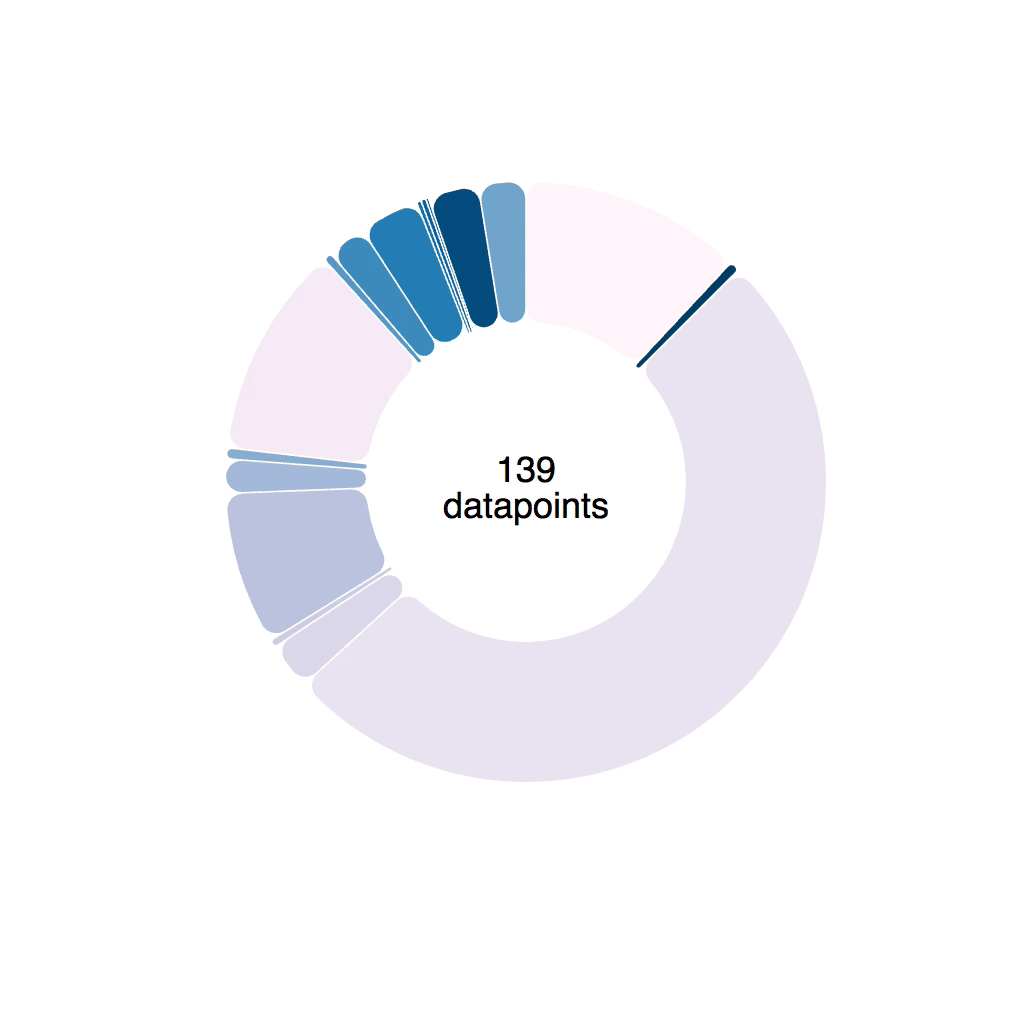 Naively implemented transition. Notice the arcs change shape sometimes[/caption]

Tweens to the rescue
Luckily, D3 lets us define custom transitions called tweens. To smoothly animate a piechart, we're going to build an arcTween. Because piecharts are made of arcs.
The idea is to move from blindly transitioning path definitions to transitioning angles on a pie slice. We're building a tween generator that takes some params and returns a tweening function.
Tweening functions are what makes transitions work, by the way. They take an argument, t, and return the value of your prop at that specific "time" of your transition.

Our tween generator is going to need:
oldData, the definition of our pie slice at the start of our transitionnewData, the definition of our pie slice that we want to tween towardsarc, a D3 arc generator
Both oldData and newData come from a D3 pie generator. Their startAngle and endAngle is what we're interested in.
Our arcTween function uses these to build a tween method that we then feed into attrTween.
// inspired from http://bl.ocks.org/mbostock/5100636function arcTween(oldData, newData, arc) {const copy = { ...oldData };return function() {const interpolateStartAngle = d3.interpolate(oldData.startAngle,newData.startAngle),interpolateEndAngle = d3.interpolate(oldData.endAngle,newData.endAngle);return function(t) {copy.startAngle = interpolateStartAngle(t);copy.endAngle = interpolateEndAngle(t);return arc(copy);};};}
We make a copy of oldData so we don't change input data by accident, then we return a function. This function creates two interpolators with d3.interpolate.
Each interpolator starts from an oldData angle and moves towards a newData angle. One for start, one for end.
This function then returns our actual interpolation function. It takes the argument t, feeds it into our two interpolators, adjusts values on the copy object, feeds that into the arc generator, and returns a new path definition.

You use it like this 👇
// Piechart.jsd3.select(this.refs.elem).transition().duration(80).attrTween("d", arcTween(this.state.d, newProps.d, this.arc)).on("end", () =>this.setState({d: newProps.d,pathD: this.arc(newProps.d)}));
Select an element, a <path>, start a transition, make it last 80 milliseconds, attrTween the path definition, d, attribute using the tween returned from arcTween.
Better? 🤪
Let's put it to use in a piechart. We're using React and D3 because React makes dataviz code easier to understand.
We build our piechart from 2 components:
- Piechart – takes data, feeds into a
d3.pie()generator, renders a bunch of arcs in a loop - Arc - takes data for an arc, feeds it into a
d3.arc()generator, renders a<path>element, handles transitions
You can see the full code on GitHub
The Piechart component itself is pretty simple. Takes some data, renders some arcs.
// Piechart.jsclass Piechart extends Component {pie = d3.pie().value(d => d.amount).sortValues(d => d.tag).padAngle(0.005);render() {const { data, groupBy, x, y, color } = this.props;const _data = groupByFunc(data, groupBy);return ({this.pie(_data).map((d, i) => ())}{data.length}datapoints);}}
We define a pie generator with a value accessor d => d.amount that sorts arcs by d.tag, and adds a padding of 0.005 between arcs. To learn more about how padding works, check out this wonderful pie padding animation by Mike Bostock.
The render method groups data by a given groupBy function, in our case by tag, then outputs a grouping element <g> inside it.
- Loops through the output of
this.pie(_data)and renders an<Arc>for each value - Creates two
<text>nodes for the center of our piechart
How data makes it into <Piechart> is outside the scope of this tutorial. You can assume data comes as an array that changes every couple milliseconds. This triggers a re-render, which propagates into our <Arc> components.
You can read that code on GitHub in the App component.
Our <Piechart> gets updated data every few milliseconds and re-renders. This change propagates into <Arc> components via props.
That means <Arc> has to handle transitions. Pushing transitions into the <Arc> component means we can preserve React's ideal of declarative rendering. Piechart just renders Arcs and gives them info. Arcs handle everything about rendering pie arcs. Even transitions.
The general approach comes from my React+D3v4 book:
- Move props into state
- Use state to render
- Transition raw attributes with D3
- Update state when transition ends
The outline for our <Arc> component looks like this 👇
// Piechart.jsclass Arc extends Component {arc = d3.arc().innerRadius(80).outerRadius(150).cornerRadius(8);constructor(props) {super(props);this.state = {color: props.color,origCol: props.color,d: props.d,pathD: this.arc(props.d)};}componentWillReceiveProps(newProps) {// transition, state update}// hover/unhover color changes via this.setStaterender() {const { color, pathD } = this.state;return ();}}
Start with an arc generator that takes data and returns path definitions. Ours has an innerRadius of 80, an outerRadius of 150, and rounded corners.
In the constructor, we copy \important props to this.state. A good choice are props that we later intend to change. Color on hover/unhover, and d and pathD on input data changes.
pathD is the part we're going to transition. It's the output of calling this.arc on this.state.d.
componentWillReceiveProps is where that transition is going to happen.
render doesn't do much. It outputs a <path> element with a ref of elem. It also defines mouse event handlers.
Adding a D3 transition to a React component
Now that <Arc> is rendering from state, we can use D3 transitions to make updates smoother. That happens inside componentWillReceiveProps.
Our goal is to take the new props, use D3 to transition appropriate attributes on the base DOM node, then update state with the new values to ensure React's engine knows what's going on.
// Piechart.js incomponentWillReceiveProps(newProps) {this.setState({color: newProps.color});d3.select(this.refs.elem).transition().duration(80).attrTween("d", arcTween(this.state.d, newProps.d, this.arc)).on("end", () =>this.setState({d: newProps.d,pathD: this.arc(newProps.d)}));}
We update color state right away. This triggers a render, eventually.
Then we start an 80 millisecond transition that uses the arcTween generator we built earlier. When the transition ends, we update React state with the new values for d and pathD. This triggers another render.
That might sound like a lot of renders, but it works okay. Don't worry about wasting resources, you're re-rendering a single <path> element. The DOM is pretty fast ☺️
[caption id="attachment_8257" align="alignnone" width="1024"]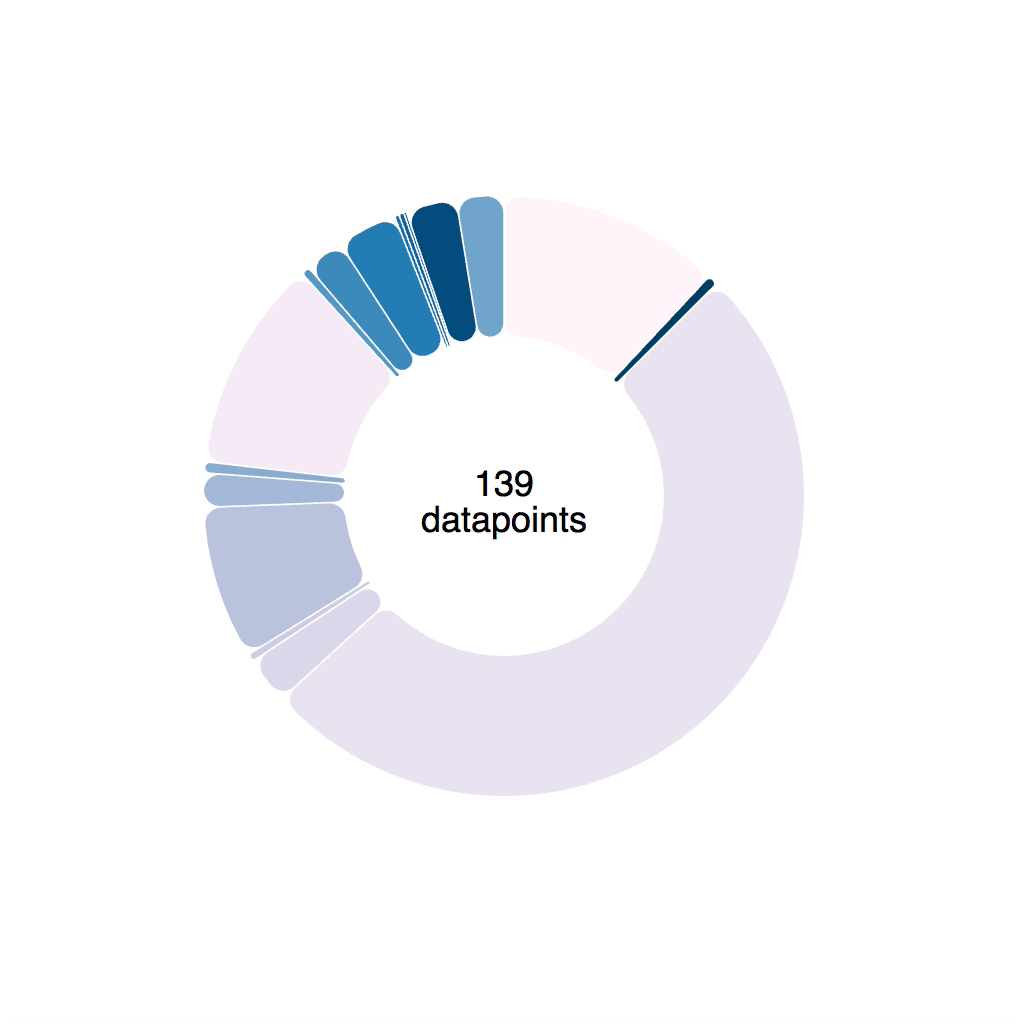 Our pie looks nice and smooth.[/caption]
Recap
You learned how to build a silky animated smooth piechart with React and D3! Yay! \o/
In a nutshell 👇
- Use custom tweens to transition complex shapes
- Render from state
- Always update state after transitions end
🤘 Party hard 🤘
To learn more about using React and D3 to write declarative data visualization code, read my book React+D3v4. I'm probably adding this as a new chapter.
About the Author

Hi, I’m Swizec Teller. I help coders become software engineers.
Story time 👇
React+D3 started as a bet in April 2015. A friend wanted to learn React and challenged me to publish a book. A month later React+D3 launched with 79 pages of hard earned knowledge.
In April 2016 it became React+D3 ES6. 117 pages and growing beyond a single big project it was a huge success. I kept going, started live streaming, and publishing videos on YouTube.
In 2017, after 10 months of work, React + D3v4 became the best book I'd ever written. At 249 pages, many examples, and code to play with it was designed like a step-by-step course. But I felt something was missing.
So in late 2018 I rebuilt the entire thing as React for Data Visualization — a proper video course. Designed for busy people with real lives like you. Over 8 hours of video material, split into chunks no longer than 5 minutes, a bunch of new chapters, and techniques I discovered along the way.
React for Data Visualization is the best way to learn how to build scalable dataviz components your whole team can understand.
Some of my work has been featured in 👇


